Home Runs, Three Point Shots and Joe DiMaggio
In 2015, there were about 4,900 home runs hit in Major League Baseball; by 2017, an all-time high of over 6,100 were hit – a growth of over 24% in two years. At the same time, strikeouts grew to over 40,000, the most ever. One reason is that the benefit of increasing home runs by swinging for the fences is perceived to be worth the higher chance of striking out.
There has been a similar change in basketball - here related to the growth in three-point shots. In the 2010-2011 season, (when the Chicago Bulls had the best record in the league!), about 16,000 three-point shots were made, on about 44,000 attempts. Skip ahead to the 2017-2018 season, almost 24,000 three-pointers were made out of about 66,000 attempts, a 50% increase. The rationale is that the higher point value of a three-pointer, compared to the two-pointer, is worth the greater chance of missing the shot.
Basketball
In basketball, the growth of three-pointers makes statistical sense. The league average success rate on two-point field goals is about 46% while the success rate of three-pointers is about 35%. Shoot 100 three-pointers and you would expect to score 105 points (100 shots * 35% * 3 points); 100 two-pointers yields only 92 points (100 shots * 46% * 2-points), or 14% less.
Baseball

It is unclear if more home runs has resulted in more overall scoring. For example, comparing 2017 versus 2001, we can see that runs scored decreased by 617 even though 647 more home runs were hit. Meanwhile, strikeouts increased by 7,700, from 32,404 in in 2001 to 40,104 in 2017. If you want to look at other years, the stats for each year since 2000 are shown below.

Let’s look at some actual 2017 player statistics – a couple of Chicago players as well as some other well-known sluggers. Note the strikeout to home run ratio (K/HR): Anderson is terrible - striking out over 9 times for each home run he hits, while Votto is excellent, striking out only 2.3 times for each home run he hits.
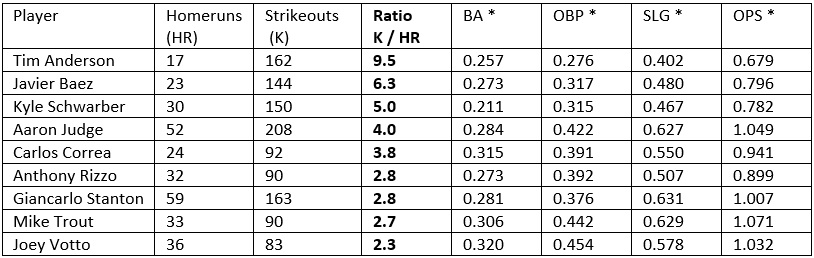
* BA = Batting Average = Hits/At Bats
OBP = On Base Percentage = (Hits + Walks) / (At Bats + Walks)
SLG = Slugging percentage = Total Bases / At Bats; Total bases award 1 point for each single, 2 for each double, 3 for each triple, 4 for each home run
OPS = On Base + Slugging – considered one of the best single numeric ways to measure a player’s batting performance

There is a clear correlation between overall batting statistics and the ratio of strikeouts/home run (K/HR). The more the player strikes out, the worse his statistics. The chart below shows this relationship. Anderson, White Sox shortstop, for example has an OPS(On Base + Slugging of .679) with a bad (high) strikeout to HR ratio; Votto, first baseman for the Cincinnati Reds, has a much higher OPS (1.032) while only striking out 2.3 times per home run. The less often a player strikes out, per home run hit, the better the overall offensive performance, using OPS (On Base + Slugging) as a measure.
Changing Hitting Approach: Theory
As a general rule-of-thumb, the average ball put-in-play results in a hit about 33% of the time. A player adjusting their hitting approach to reduce strikeouts is going to put more balls-in-play, resulting in more hits. They will probably hit less home runs as they no longer will be swinging for the fences on every pitch. For example, let's speculate that Tim Anderson reduced his strikeouts in half, from 162 to 81 – putting the ball in play 81 more times. With the 33% rule-of-thumb, Anderson would have about 27 more hits (1/3 of 81). Or Anthony Rizzo reduces his K’s from 90 to 45, putting the ball in play 45 more times generating 15 more hits.
We can adjust these players statistics by reducing home runs, increasing hits and recalculating their OPS (On-Base + Slugging). The table shows the original OPS, re-calculated OPS and the percentage change in OPS.

Some interesting results, for example, Aaron Judge's OPS would be 4.3% higher if he had only 40 home runs and 100 strikeouts instead of 50 home runs and 200+ strikeouts. For most players, if they could cut down on strikeouts they would be a better offensive performer, even at the cost of reduced home runs.
Changing Hitting Approach: It Works
Some players have already changed their hitting approach, resulting in improved offensive performance.
Mike Trout, as awesome as he was back in 2014, look at his 2017 season, even more outstanding with his strikeouts cut in half, even though he hit fewer home runs.
Justin Turner, Los Angeles Dodger with the big red beard – fewer home runs, fewer strikeouts, better season
George Springer, 2017 World Series MVP for the Astros, cut his strikeouts by about 40% over 2016, with a better overall result

Joe DiMaggio
Let’s conclude by looking at some all-time sluggers. If you think Joe DiMaggio’s 56-game hitting streak was an unbreakable record, check out his strikeout to home run ratio in the table. No one is ever going to match that - a one-to-one ratio. And look at the other names – Williams, Musial, Gehrig, Aaron. Today's players are not even coming coming close.
Perhaps these baseball stars have something to teach the modern player, about reducing strikeouts.

Conclusion
I think the three-point trend in basketball makes sense and will continue, but many baseball players need to re-visit their approach at the plate and just put the ball-in-play.